Mastering Linear Equations: Formulas, Graphing, and Real-World Examples
What makes an equation linear? One simple rule: the power of x is always 1. No x², no √x, no 1/x. Plot it on a graph and you always get a perfectly straight line.
You use linear maths constantly without noticing. A cell phone bill with a flat fee plus a charge per gigabyte, or a ride-share fare with a base price plus a cost per kilometre, both follow a linear equation. This guide shows you the formula, how to read it, how to graph it, and how to solve a real problem with it.
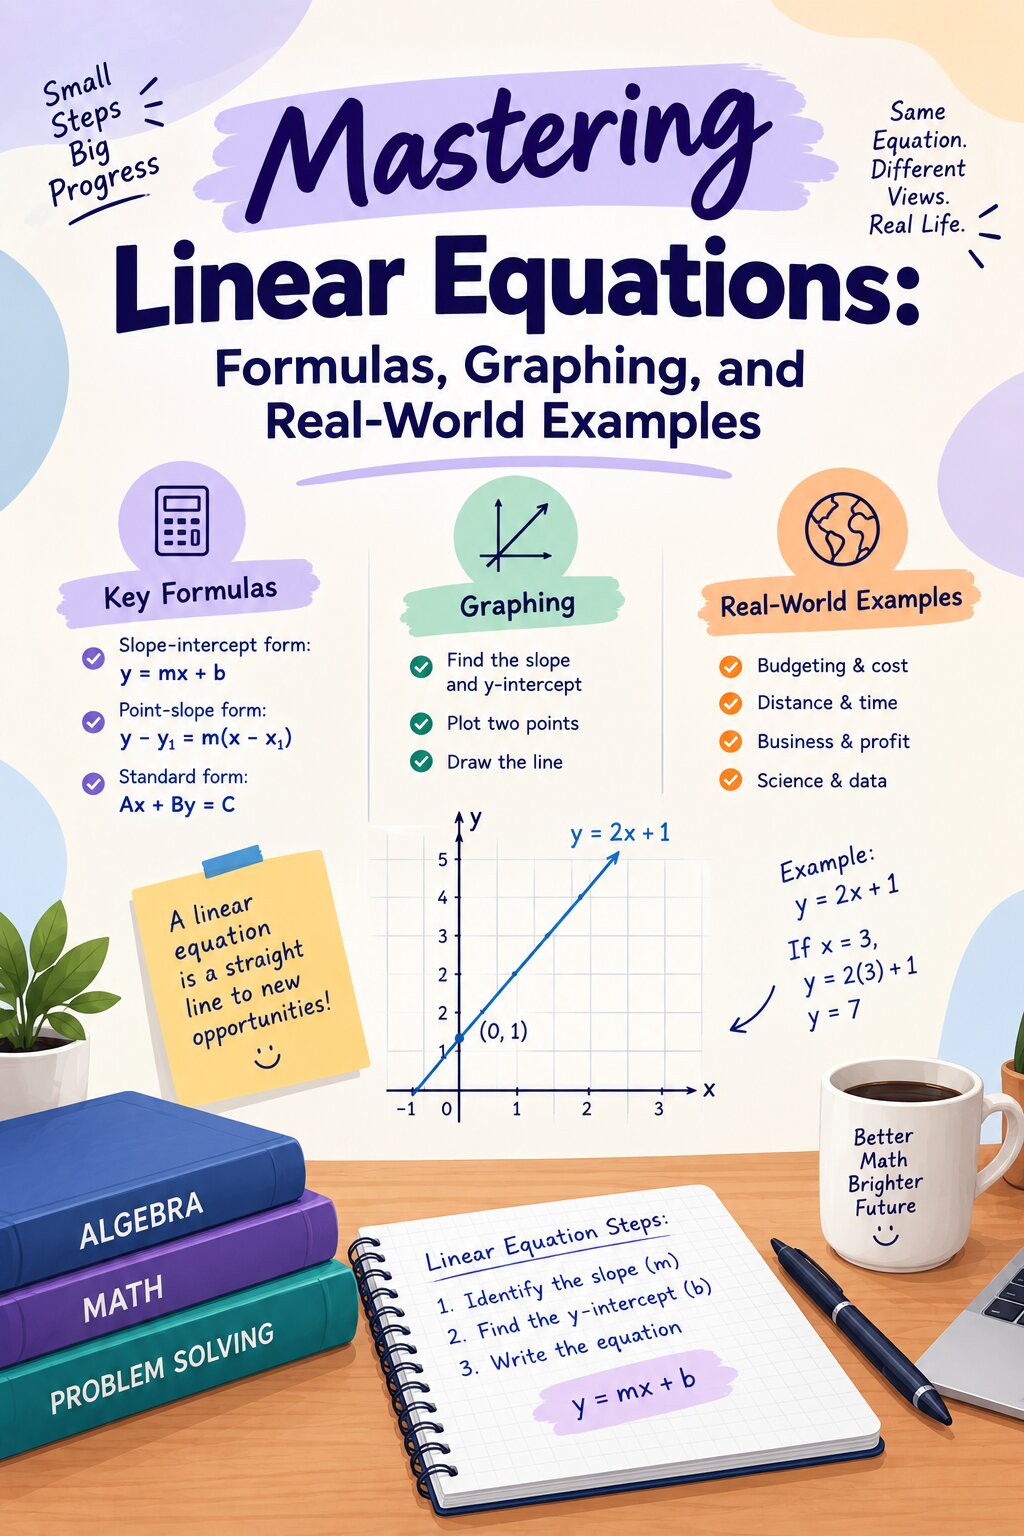
The Holy Grail of Algebra: Slope-Intercept Form
Breaking Down the Components (y = mx + b)
- y is the dependent variable. Its value depends on what x is.
- x is the independent variable. You choose it, and y follows.
- m is the slope. It says how steep the line is and which direction it tilts.
- b is the y-intercept. It is the point where the line crosses the vertical y-axis.
In y = 2x + 1, the slope is m = 2 and the y-intercept is b = 1. Once you can spot m and b, you can sketch the line in seconds.
Understanding Slope and Intercept Visually
What is Slope (m)? The Classic "Rise Over Run"
Slope measures how much the line goes up or down (rise) for every step it moves sideways (run). To find it from two points, use:
Example: a line passes through (1, 3) and (3, 7).
- Positive slope: the line rises from left to right.
- Negative slope: the line falls from left to right.
- Zero slope: a flat horizontal line.
- Undefined slope: a vertical line, where the run is 0.
What is the Y-Intercept (b)? The Starting Line
The y-intercept is where the line starts on the y-axis, which is the value of y when x = 0. Substitute x = 0 into y = 2x + 1 and you get y = 1, so the line crosses the y-axis at (0, 1). In real life, b is usually the "starting amount" before anything changes, such as a flat monthly fee.
How to Graph a Linear Equation Step-by-Step
Let's graph y = ½x + 1, so m = 1/2 (rise 1, run 2) and b = 1.
Plot the b value on the vertical y-axis. Put your first dot at (0, 1).
Use the slope fraction. From (0, 1), go up 1 (rise) and right 2 (run) to reach (2, 2). Repeat to find (4, 3).
Connect the dots with a straight edge and extend the line past both ends, adding arrows.
y = ½x + 1: start at (0, 1), then "rise 1, run 2"
Real-World Scenario Walkthrough: The Phone Plan Dilemma
A phone plan costs a $20 flat fee per month plus $5 for every gigabyte (GB) of data used. How much will you pay if you use 4 GB?
Choose variables. Let x = GB of data used and y = total monthly cost.
Match to y = mx + b. The $5 per GB is the slope (m = 5) and the $20 flat fee is the y-intercept (b = 20).
Write the equation and substitute x = 4:
y = 5(4) + 20
y = 20 + 20 = $40
Bonus question: with a $60 budget, how many GB can you use? Replace y with 60 and solve for x:
40 = 5x
x = 8 GB
Notice the story hidden in the equation: even at 0 GB you still pay $20 (the intercept), and every extra GB adds $5 (the slope). Swap the dollar sign for ₹ and the method stays identical.
Conclusion: Master Your Algebra Assignments
Graphing by hand builds the spatial memory that makes algebra click: you start to see equations as pictures. Do your plotting on graph paper first, then audit your coordinates and answers with Maths Homework Help, which shows each step so you can find exactly where a slip happened.
Ready for the next level? Continue with quadratic equations, or explore our full set of student calculators.